6.8. Experimental procedures for detecting functionally related sequences#
Since DNA sequences can encode function, it holds that different sequences demonstrated to encode a comparable property should be similar. For instance, different sequences that are able to bind a specific protein (e.g. TBP) will share sequence features in common. This perspective motivates development of experimental and statistical techniques to uncover how such functional information is encoded.
What sort of experiments can be conducted that allow identifying whether there is a particular diagnostic DNA sequence motif to which a protein binds? Whatever the nature of the experiment, we need a means for isolating a collection of sequences that are enriched for those that bind to the protein of interest. The experiment also needs to be able to identify the sequence of DNA molecules that have bound. Once that data exists we enter the world of computation and statistical analysis.
There are a variety of experimental procedures that can used for this purpose [GM10]. I will discuss just two of those here.
6.8.1. SELEX – Systematic evolution of ligands by exponential enrichment#
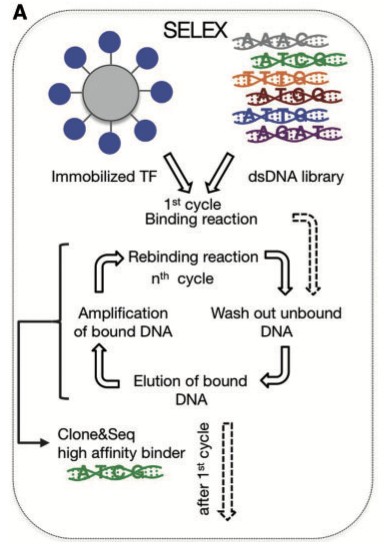
This procedure is entirely in vitro. The inputs are a substantial amount of enriched protein [1] which is bound to a bead. Also required is a library of synthetically produced double stranded DNA of a precise fragment size. These two substrate are then incubated together under conditions favourable to binding of the DNA and protein. By eluting the unbound DNA fragments, you wind up with beads that have bound DNA. Those DNA fragments are then dissociated from the beads and amplified using PCR. This new DNA pool is then reintroduced to bead-bound protein and the process is repeated. (Only a few a rounds are done.) At the end of these iterations, the bound DNA is isolated again and the collection of DNA fragments is sequenced.

A synthetic sequence assessment procedure.#
6.8.2. ChIP – chromatin immunoprecipitation#
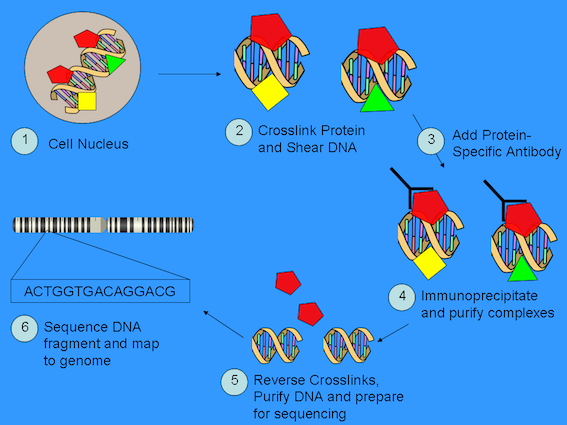
ChIP-seq is an in vivo process. A precursor for this technique is the availability of an antibody with high specificity for the protein of interest. With this in place, the cellular material of interest is exposed to formaldehyde which causes formation of cross linking (via covalent bonds) between DNA and whatever else is bound to it. The cells are then lysed and the DNA protein mix extracted and sheared [2] to a size suitable for the sequencing technology that will be used. You then expose the sheared DNA+protein mixture to the antibody and precipitate bound complexes. This step is followed by chemistry that reverses the cross linking, the protein is removed and the collection of DNA fragments are sequenced.
Sonication being one approach.

6.8.3. With the sequence data from those experimental procedures#
Identifying a dominant motif requires a way of summarising features across a collection of sequences. For instance, we can “align” fragments and employ a majority rule consensus approach. This just picks the most frequent state in a column of aligned sequences.
01234 <-- the "index" or position
TCAGA
TTCCA
TTCCA
TTTTC
TTTTC

TTCTA <-- the majority consensus
Challenges to this approach include handling the case of equally abundant states (a random choice at positions 2 and 3), and masking the possible importance of other states. An alternate approach to handling this issue of multiple characters is to use IUPAC ambiguity characters to capture all states at a column.
01234
TCAGA
TTCCA
TTCCA
TTTTC
TTTTC

TYHBM <-- the IUPAC consensus
Note
In the above, Y is either C or T.
6.8.4. Transformation of the data for analysis#
From an experimental procedure, we ultimately seek to obtain a curated set of “aligned” sequences. I illustrate a hypothetical such case below [4].
Positions displaying a . have the same nucleotide as "seq-0" for that column.
| 0 | |
| seq-0 | ATTTATG |
| seq-1 | ..A..AA |
| seq-2 | T.A..AA |
| seq-3 | T.AA.A. |
| seq-4 | ..AA... |
| seq-5 | ..A.... |
| seq-6 | ..A..G. |
| seq-7 | ..AA.AA |
| seq-8 | ..AA..C |
| seq-9 | ..A.T.A |
10 x 7 dna alignment
This is converted to a table of nucleotide counts per aligned column, resulting in a Position specific Weights Matrix (or PWM).
| Base \ Position | 0 | 1 | 2 | 3 | 4 | 5 | 6 |
|---|---|---|---|---|---|---|---|
| T | 2 | 10 | 1 | 6 | 1 | 5 | 0 |
| C | 0 | 0 | 0 | 0 | 0 | 0 | 1 |
| A | 8 | 0 | 9 | 4 | 9 | 4 | 4 |
| G | 0 | 0 | 0 | 0 | 0 | 1 | 5 |
This table becomes the primary source for defining PSSMs.
Citations
Marcel Geertz and Sebastian J Maerkl. Experimental strategies for studying transcription factor-dna binding specificities. Brief Funct Genomics, 9:362–73, 2010. doi:10.1093/bfgp/elq023.